


Table of contents
Getting started to learn about machine learning is quite interesting, but it too needs the clarity of mathematical concepts. Behind ML and data science is the analysis and interpretation of data. Having data does nothing but analysing the patterns and inferring some knowledge from it would be beneficial.
Refer to the resource below for interactive learning
What is Probability?
Probability is the chance of something happening, or how likely is the event going to occur. For Example, if there is a 50% probability of rain tomorrow, it means that there is a 50% chance of rain. It gives the quantity interpretation of occurring an event.
What is its Importance?
Probability helps us understand and quantify uncertainty in various situations. It allows us to make predictions even when outcomes are not entirely certain.
Probability is essential in data analysis and statistics. It helps us analyze and interpret data, estimate parameters, and assess the reliability of results.
In manufacturing and quality control, probability is used to assess the quality of products and identify defects.
The rolling of fair six sided Die, this die has an equal chance of outcome for every face landing up (from 1 to 6)
By rolling the die some times some faces may land up several times, but the total unique number of faces makes up the sample space. So in this case the Sample space is
S = {1,2,3,4,5,6}
Rolling the dice and the chance of occurring the 4 dotted faces on upward is an event (E).
What is Probability Distribution?
Probability distribution gives the possibility of each outcome of a random experiment or event. It provides the probabilities of different possible occurrences.
if we toss a coin, we cannot predict, what outcome it will appear either it will come as a Head or as a Tail. The possible result of a random experiment is called an outcome. And the set of use outcomes is called a sample point. With the help of these experiments or events, we can always create a probability pattern table in terms of variables and probabilities that describes all the possible values and probabilities for a random variable within a given range.
The probability distribution of random variables can be discrete or continuous. This distribution is based on the Probability Mass function and Probability Density Function respectively.
Discrete Probability Distribution
Discrete Probability distribution describes the probability of occurrence of each value of a discrete random variable.
Example: The number of spoiled apples out of 6 in your refrigerator can be an example of a discrete probability distribution.
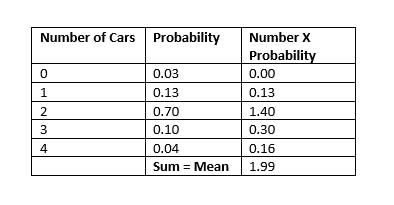
If the discrete distribution has a finite number of values, you can display all the values with their corresponding probabilities in a table. For example, the Probability for the number of cars
Binomial distribution displays binary data, such as coin tosses.
Poisson distribution models count data, such as the count of library book checkouts per hour.
Uniform distribution is multiple events with the same probability, such as rolling a die.
Continuous Probability Distribution
This type of Distribution denotes the Probability of occurrence of continuous values of random variables. This distribution relates to the probability density function of a continuous random variable
Continuous variables are often measurements on a scale, such as height, weight, and temperature
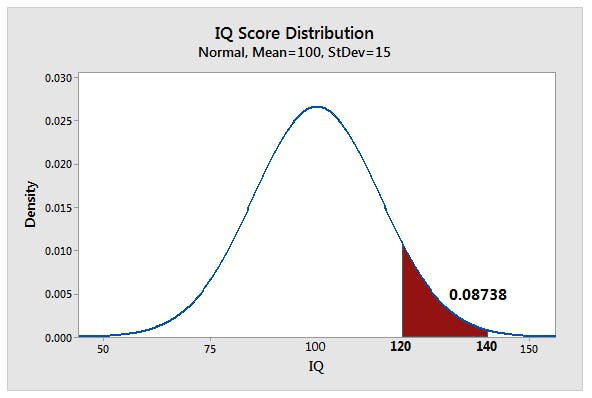
Probability indicates the likelihood that a value will fall within an interval. This property is straightforward to demonstrate using a probability distribution plot
most well-known continuous distribution is the normal distribution, which is also known as the Gaussian distribution or the “bell curve.”
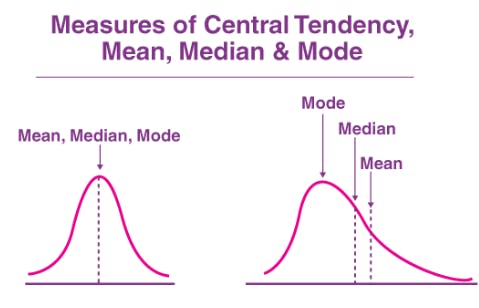
What is Central tendency?
Central Tendency refers to the middle, typical, or central value of a distribution of data. Central tendency measures provide a way to summarize and understand the central value of a dataset.
What are the measures of Central tendency?
Mean: Sum of all the marks of students in your class in a specific subject divided by the total number of students gives the average marks of students in the class. It may not be the marks that any student has scored. It can be said as the performance marks of the class.
Marks = {3, 5, 7, 9, 11} then mean = (3 + 5 + 7 + 9 + 11) / 5 = 7.
It is affected by some maximum and minimum marks scored by students which are known as outliers
.
Median: The middle value in the set of marks can be said as median, Median is not affected by the maximum and minimum scores
Marks = {3, 5, 7, 9, 11}, the median marks = 7.
Mode: Mode can be described as marks which more students have scored.
Marks = {3, 5, 7, 7, 9, 11}, the mode = 7 .more
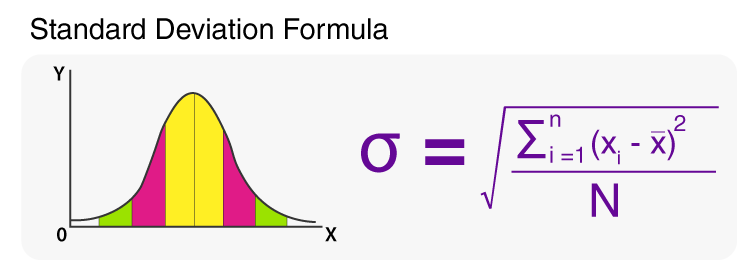
Standard Deviation
It is a measure that gives the amount of variation of a particular data point in the probability distribution of data. It is the indication of how far the data point is from the mean of the distribution.
Key Points:
More is the standard deviation states data points spread out more, while lower standard deviation indicates the data points are closer to mean
Standard deviation is sensitive to extreme values (outliers) in the dataset, as it involves squaring the differences between data points and the mean. Outliers can significantly affect the standard deviation
The standard deviation has the same units as the original data points, making it easier to interpret and compare with the mean
What is Correlation?
Correlation is the quantitative measure that is used to assess in what manner two variables are linearly related to each other.
imagine that you are looking at a dataset of campsites in a mountain park. You want to know whether there is a relationship between the elevation of the campsite (how high up the mountain it is), and the average high temperature in the summer.
For each individual campsite, you have two measures: elevation and temperature. When you compare these two variables across your sample with a correlation, you can find a linear relationship: as elevation increases, the temperature drops. They are negatively correlated.
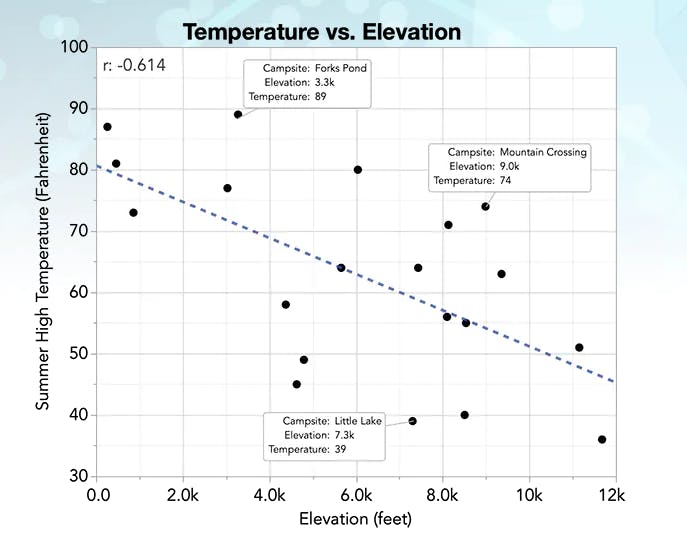
The correlation coefficient (r) ranges from -1 to +1.+1 indicates a perfect positive correlation, -1 indicates a perfect negative correlation, and 0 indicates no linear correlation
magnitude of the correlation coefficient indicates the strength of the relationship
Correlation is often visualized using scatter plots, where the data points are plotted on a graph to show the relationship between the variables.
Correlation does not imply causation. Even if two variables are strongly correlated, it does not necessarily mean that one causes the other is Conditional Probability
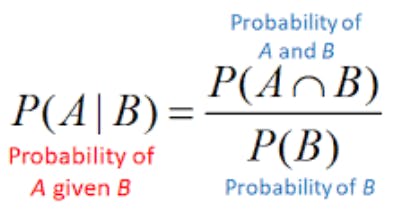
What is Conditional Probability
It is defined over another event, it is the probability of an event B that B will occur with event A already occurred. This can be denoted as P(B|A). Here A and B are independent Events.
In a card game, suppose a player needs to draw two cards of the same suit in order to win. Of the 52 cards, there are 13 cards in each suit. Suppose first the player draws a heart. Now the player wishes to draw a second heart. Since one heart has already been chosen, there are now 12 hearts remaining in a deck of 51 cards. So the conditional probability P(Draw second heart|First card a heart) = 12/51.
Click here - Interactive learning
Conclusion
This is just a gist of Probability and Statistics, there are many such topics that must learn to build a base to learn machine learning algorithms. Some topics can be Bayes' Theorem and Bayesian Probability, Law of Large Numbers, Joint Probability Distributions, MLE etc.
Subscribe to the newsletter for learning more about such interesting concepts. Give a LIKE which motivates me to bring up such amazing content.